


THREATENED SPECIES™ (Click on the link for more details)
Red List Index
The Red List Index (RLI) was developed to show trends in overall extinciton risk for species and provide an indicator that is used by governments to track their progress in achieving targets that reduce biodiversity loss.
With many different reasons for species changing status on The IUCN Red List (see the section Reasons for Changing Category), it is impossible to determine any meaningful trends in the status of biodiversity simply by looking at overall changes in numbers of threatened species between updates. For this reason, the figures presented in the Summary Statistics for numbers of threatened species in each IUCN Red List since 1996 must be interpreted with extreme care; these figures illustrate increasing assessment efforts by IUCN and its Partners since 1996, helping to refine our current understanding of the status of biodiversity, rather than showing genuine status changes over time.
To disentangle the effects of increased effort invested in assessing species, and to focus only on genuine status changes (i.e., species that have genuinely improved or deteriorated in status), IUCN developed the Red List Index (RLI). The RLI provides a clearer view of real trends within different taxonomic groups, and for biodiversity as a whole.
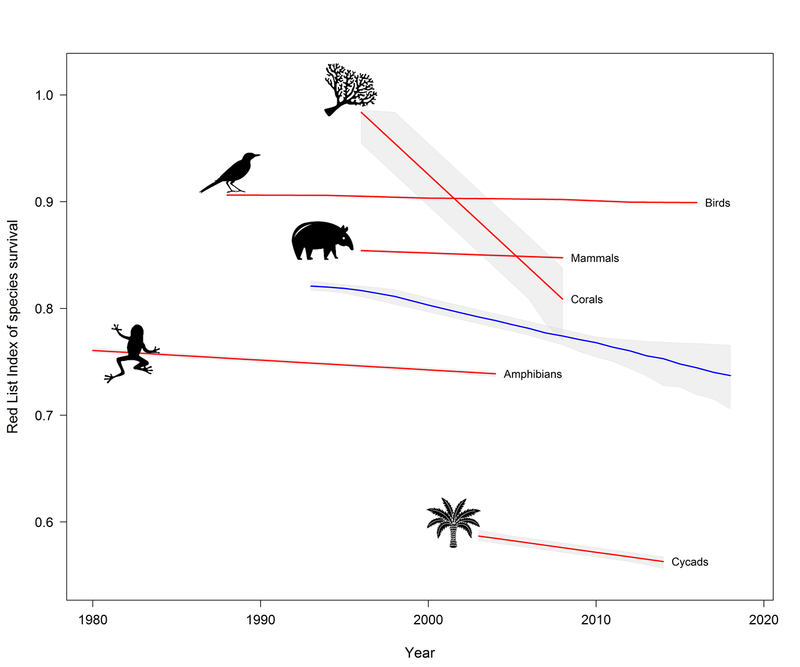
Figure 1: The IUCN Red List Index (RLI) of species survival for mammals, birds, amphibians, reef-forming corals and cycads. Coral species are moving towards increased extinction risk most rapidly, while amphibians are, on average, the most threatened group. An RLI value of 1.0 equates to all species qualifying as Least Concern (i.e., not expected to become Extinct in the near future). An RLI value of 0 equates to all species having gone Extinct. A constant RLI value over time indicates that the overall extinction risk for the group is constant. If the rate of biodiversity loss were reducing, the RLI would show an upward trend. The blue line indicates the overall RLI for all the taxa combined. Confidence intervals (shown in grey) are calculated to take into account the number of Data Deficient species in each group and the uncertainty over exactly when changes in status occurred, given that assessments are repeated only at multi-year intervals, and therefore the precise value for any particular year is uncertain.
Currently, the RLI is available for five taxonomic groups only (those in which all species have been assessed at least twice): birds, mammals, amphibians, cycads and corals (see Figure 1). It has also been aggregated into a single index for those five groups (see Butchart et al. 2005 for methodology). The RLI clearly demonstrates that the status of these major groups is still declining. An increasing number of national RLIs are now being used by countries to monitor biodiversity loss.
The Red List Index can be disaggregated to show national and regional Red List Indices, weighted by the fraction of each species' distribution occurring within a particular country or region, building on the methodology published by Rodrigues et al. (2014). These show an index of aggregate survival probability (the inverse of extinction risk) for all birds, mammals, amphibians, corals and cycads occurring within the country or region. The index shows how well species are conserved in the country or region selected to its potential contribution to global species conservation. The R code for calculating and plotting these national RLIs is available from here in English.
Rising to the global challenge of reducing biodiversity loss by 2010 (as adopted by the Parties to the Convention on Biological Diversity (CBD)) required tools to monitor our progress and highlight where we need to focus our conservation efforts. Hence the driving focus of the IUCN Global Species Programme and SSC has been to develop The IUCN Red List in a manner that allows a Red List Index to be calculated and measured over time. The Red List Index played a key role in tracking progress towards the 2010 target and has been adopted by CBD to track progress on seven of the 20 Aichi Biodiversity Targets.
In recognition that targets such as CBD 2010 require a more rapid approach to generating conservation assessments across mega-diverse taxonomic groups, a sampled approach to the Red List Index: the Sampled Red List Index (SRLI) has been developed in order to determine the threat status and trends of lesser-known and less charismatic species groups.
More publications about the Red List Index are available in the Resources and Publications section (search for "Red List Index").
Spatial Data Download (SPATIAL DATA & MAPPING RESOURCES)